
Description
The Engagement Analytics dashboard shows how recipients interact with the email signatures sent by your company.
Analytics requires Server-Side configuration to function. You can use Analytics on Client-Side deployment, but only if you have enabled and configured Server-Side. For help setting up Server-Side, see our onboarding guides for either Microsoft subscriptions or Google subscriptions.
How to access it
To access the Engagement Analytics:
- From the menu sidebar, select Analytics.
- Select the Engagement tab.
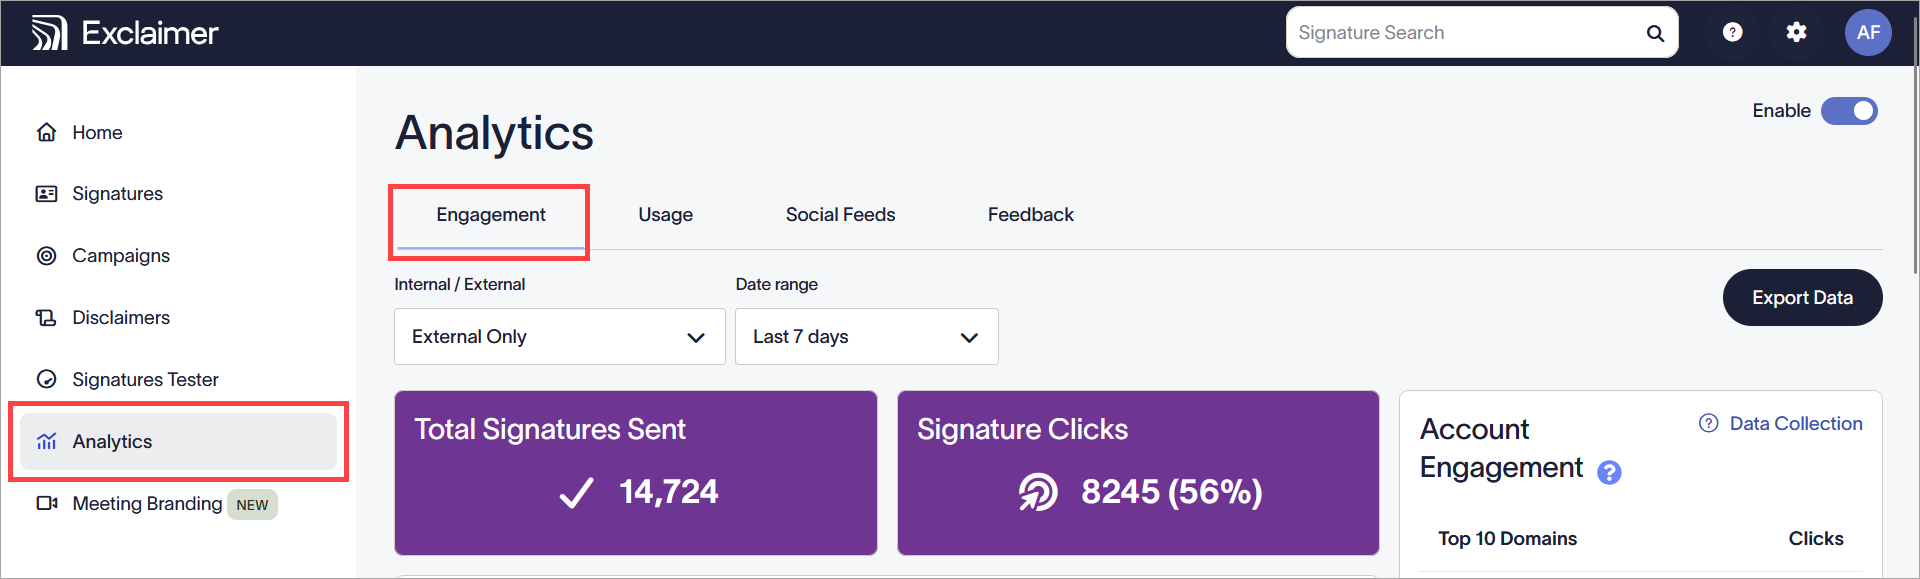
Select Analytics, then Engagement.
Understanding Engagement Analytics
In order for the data to be collected and displayed on the dashboard, your emails must be routed through the Exclaimer servers. Hyperlinks are automatically rewritten and redirected through Exclaimer's click tracking service.
URLs have a regional code <Region Code> prefixed to them.
You can choose whether to collect analytics data using the Enable toggle. 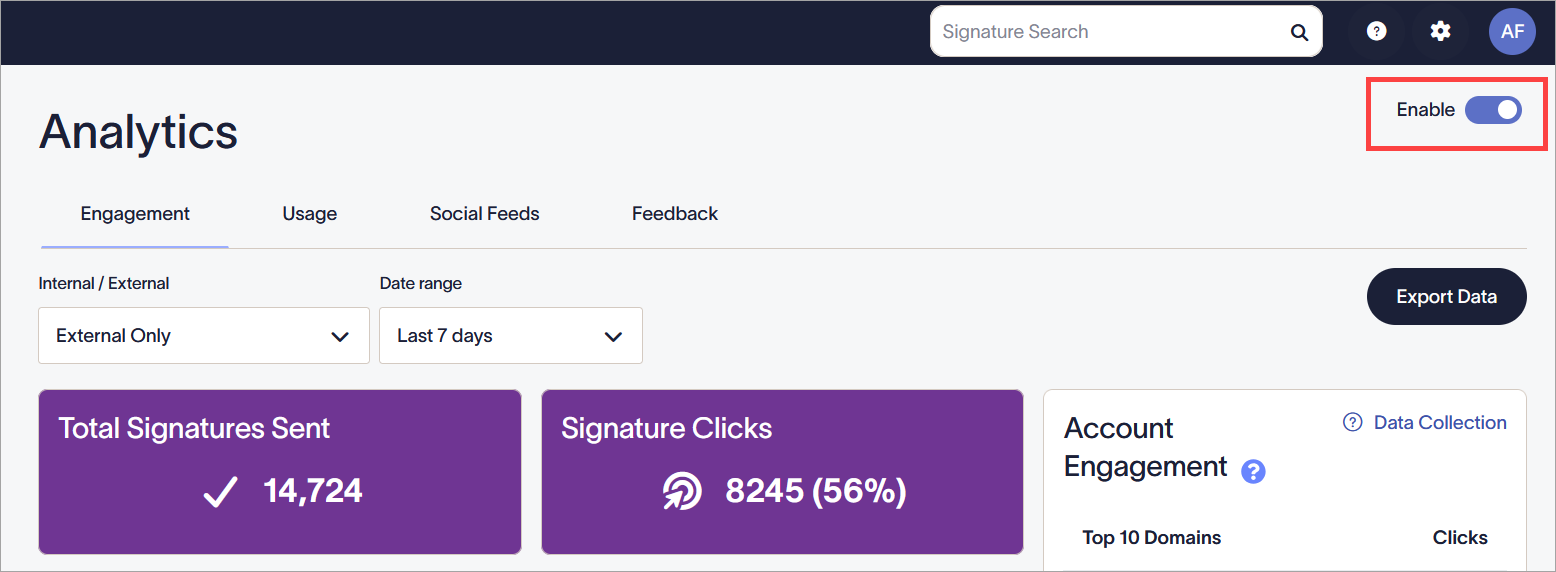
The Enable toggle in the On position.
If analytics is not enabled, your links are not changed, and data is not collected. Your dashboard will not show any data.
The Engagement Analytics dashboard displays information to help you analyze how recipients interact with your email signatures.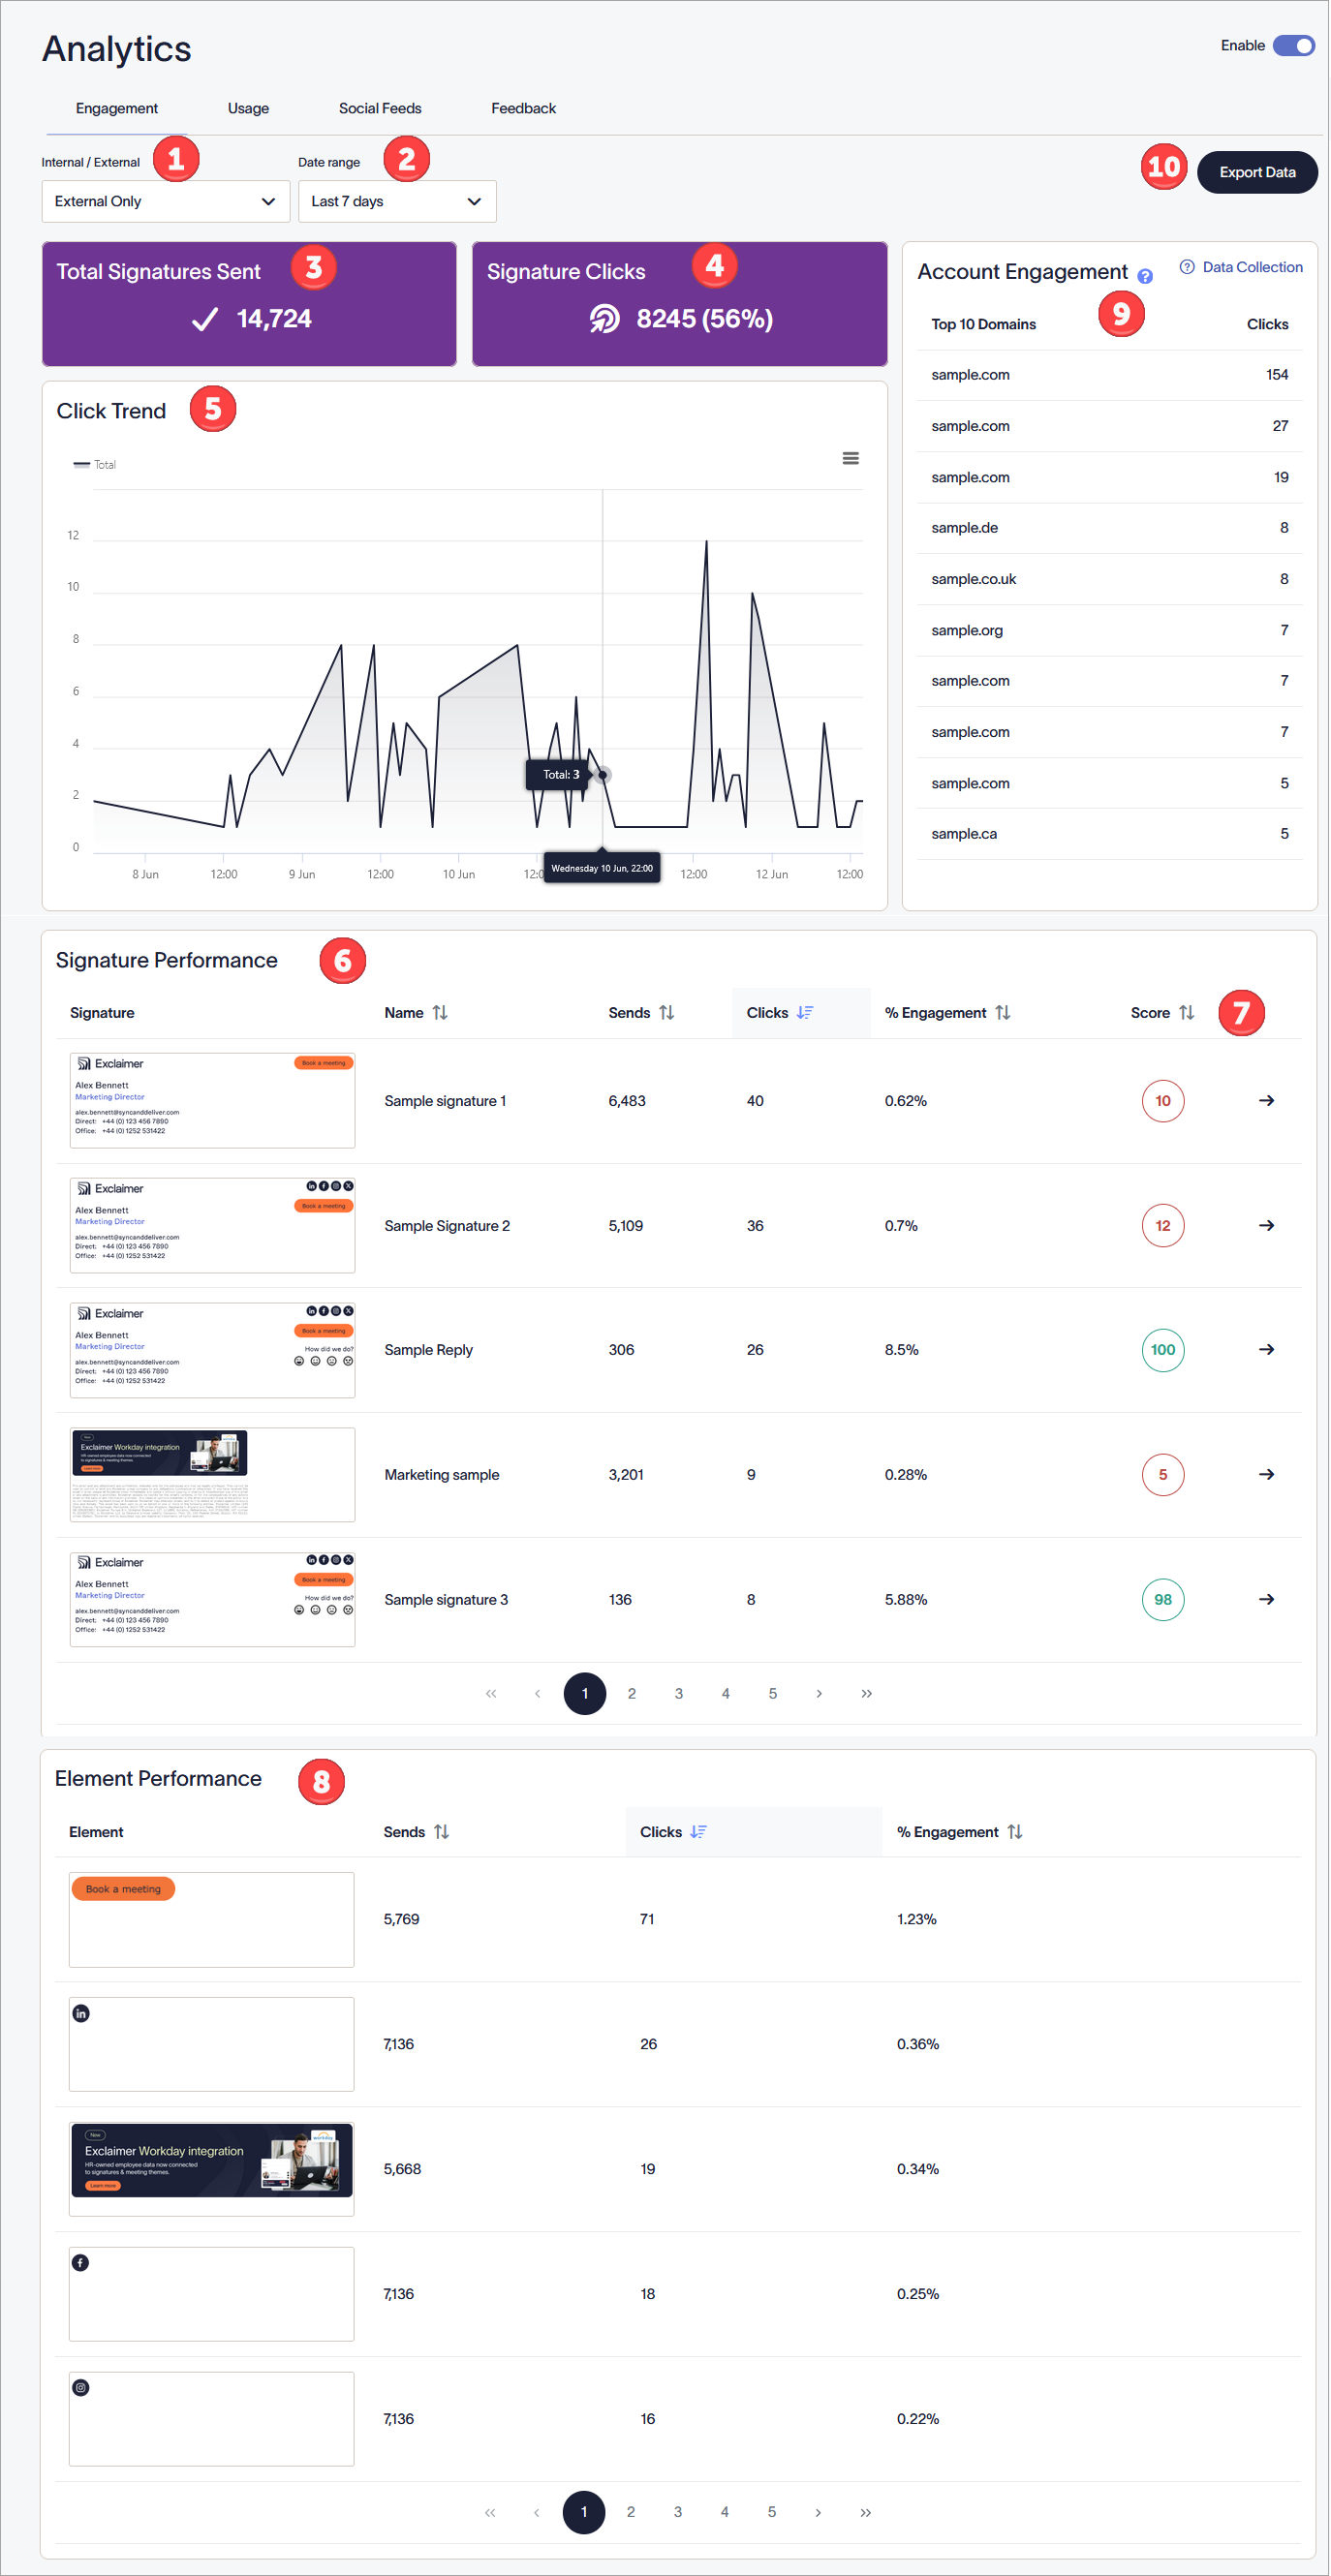
The Engagement Analytics dashboard. Each number corresponds to a different section of the screen. Each section is described in the table.
The following table outlines the different options available on the Engagement Analytics dashboard:
| Screen area | Feature description |
|
Internal/External |
Select a type of email from the drop-down list:
|
|
Date Range |
Select a date range from the drop-down list:
To set a Custom date range, enter or select a start and end date and time using the calendar picker. |
|
Total Signatures Sent |
Displays the total number of signatures used in emails within the selected date range. |
|
Signature Clicks |
Displays the total number and percentage of clicks on signature links within the selected date range. |
|
Click Trend |
A line graph displaying the number of clicks on signature links within the selected date range. The axes are Y - Number of Clicks and X - Date and Time. Place the cursor over points on the graph to show the number of the clicks at that point in time. |
|
Signature Performance |
Displays all sent signatures. Each page displays five signatures. Use the page numbers to view more signatures. The following fields are displayed for each signature: NOTE: It is possible for a signature to reach over 100% engagement.
By default, signatures are sorted by highest to lowest number of clicks. Select any of the field column names to sort signatures by that field. The direction of the arrows shows whether the sort is ascending or descending. |
|
|
Select the arrow  to view the Signature Score dashboard. to view the Signature Score dashboard. |
|
|
Displays all different clickable elements in signatures. Each page displays five elements. Use the page arrows to view more elements. NOTE: It is possible for an element to reach over 100% engagement.
By default, elements are sorted by highest to lowest number of clicks. Select any of the field column names to sort elements by that field. The direction of the arrows shows whether the sort is ascending or descending. |
|
Account Engagement |
Displays the top 10 domains that have interacted with signatures over the selected date range, shown by number of clicks. |
|
Export Data |
Select EXPORT DATA to download a .csv file containing all data for the selected date range to your device. |
Select the blue arrow ![]() to view the analytics for a single signature.
to view the analytics for a single signature.
Each area of the analytics screen changes to reflect only data for the selected signature.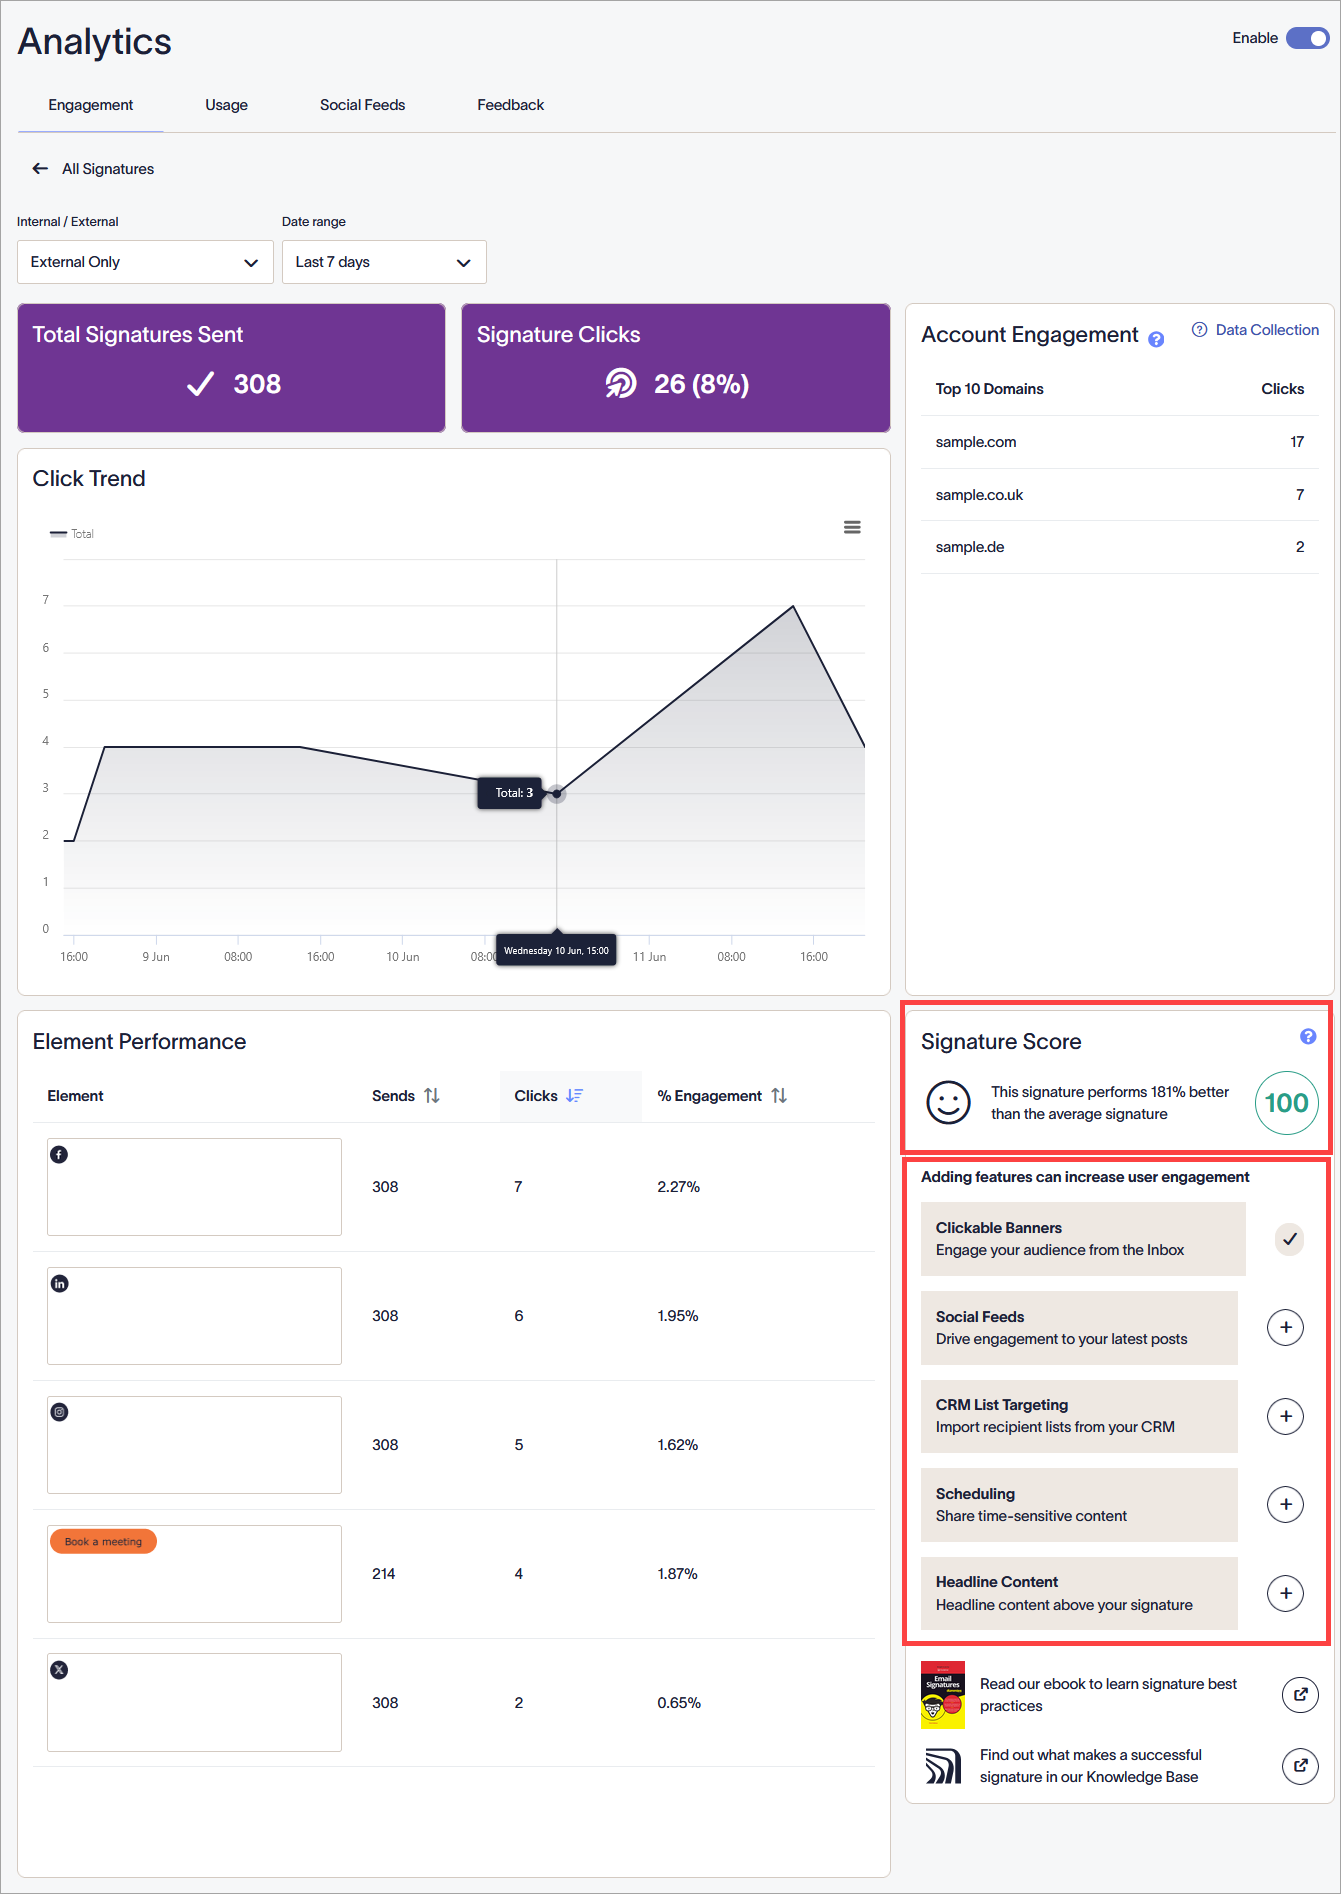
The Engagement Analytics for a selected signature. Each area shows only the data for the selected signature.
Signature Score
This widget shows a detailed Score overview for the signature. This uses the Score to describe how well it is performing against the average.
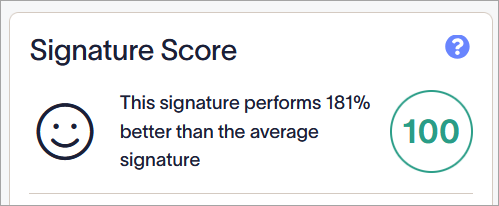
The score has a color and graphic to represent its performance.
The different variants of the signature score are:
No rating - The signature has not received enough clicks to determine a score.
Red rating - The signature has a score of 25 or lower.
Yellow rating - The signature has a score between 25 and 50.
Green rating - The signature has a score of 50 or higher.
Under Adding features can increase user engagement, there are five recommended signature features.
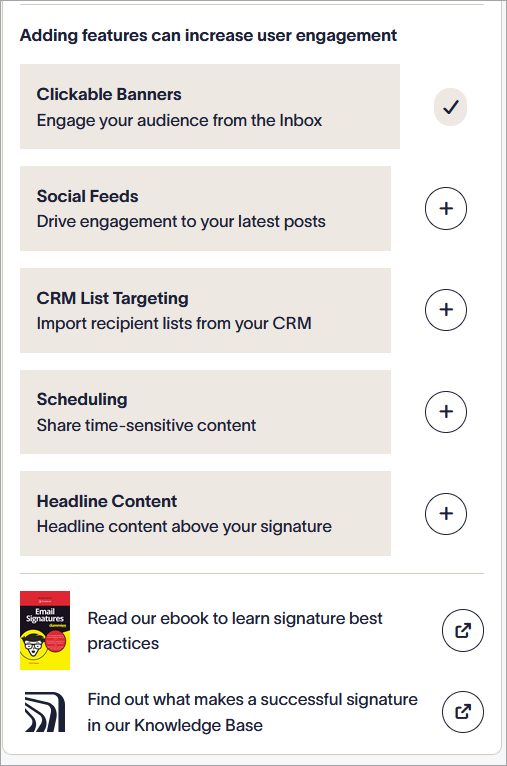
The recommendations displayed in the Signature Score widget.
Select the Plus icon + or the Open icon![]() next to the features to open the following pages:
next to the features to open the following pages:
| Recommendation | Icon Navigation |
| Clickable Banners | Opens your signature in the signature designer |
| Social Feeds | Opens your signature in the signature designer |
| CRM List Targeting | Opens the Recipient rules tab for your signature |
| Scheduling | Opens the Date/Time rules tab for your signature |
| Headline Content | Opens your signature in the signature designer |
| Read our ebook to learn signature best practices | Opens the shopping page for our ebook |
| Find out what makes a successful signature in our Knowledge Base | Opens the home page of the Knowledge Base |
To close the Signature Score dashboard and return to the list of signatures, select All Signatures.
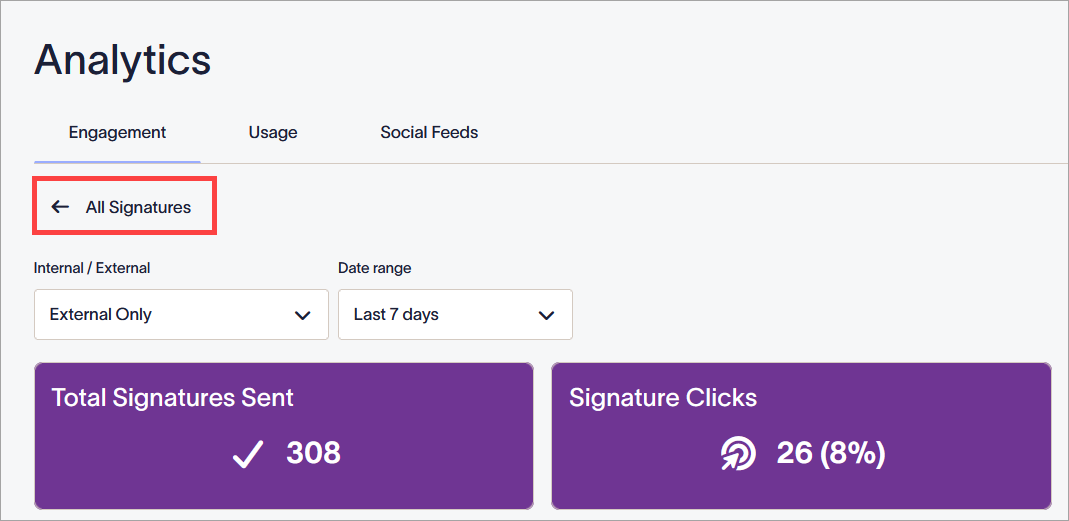
The All Signatures button returns to the full dashboard. It is found above the Internal/External and Date Range menus.