
Description
The Usage Analytics dashboard shows how your signatures are being used.
Analytics requires Server-Side configuration to function. You can use Analytics on Client-Side deployment, but only if you have enabled and configured Server-Side. For help setting up Server-Side, see our onboarding guides for either Microsoft subscriptions or Google subscriptions.
How to access it
To access the Usage Analytics:
- From the menu sidebar, select Analytics.
- Select the Usage tab.
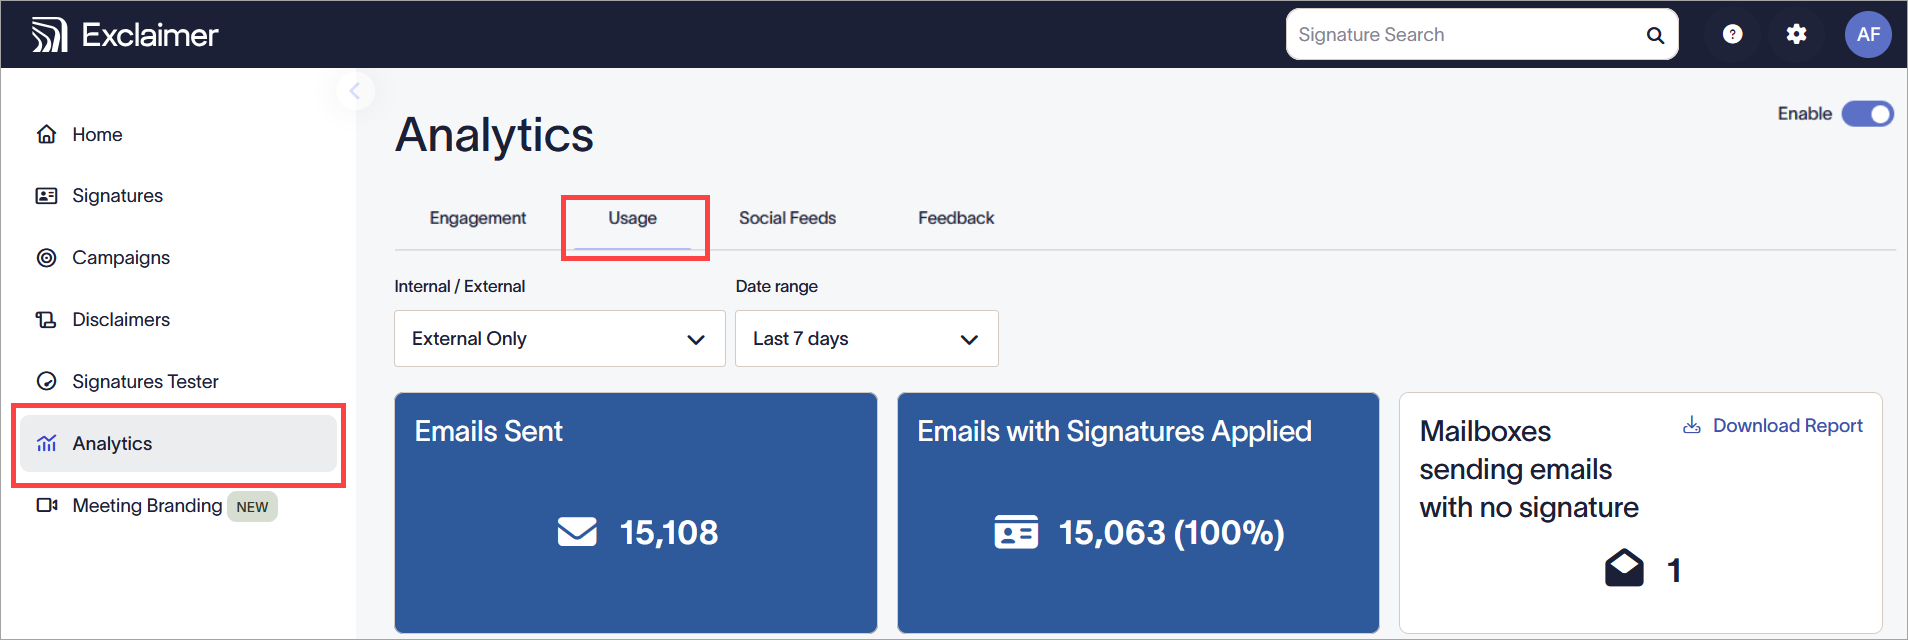
Select Analytics, then Usage.
Understanding Usage Analytics
In order for the data to be collected and displayed on the dashboard, your emails must be routed through the Exclaimer servers. Hyperlinks are automatically rewritten and redirected through Exclaimer's click tracking service.
URLs have a regional code <Region Code> prefixed to them.
You can choose whether to collect analytics data using the Enable toggle. 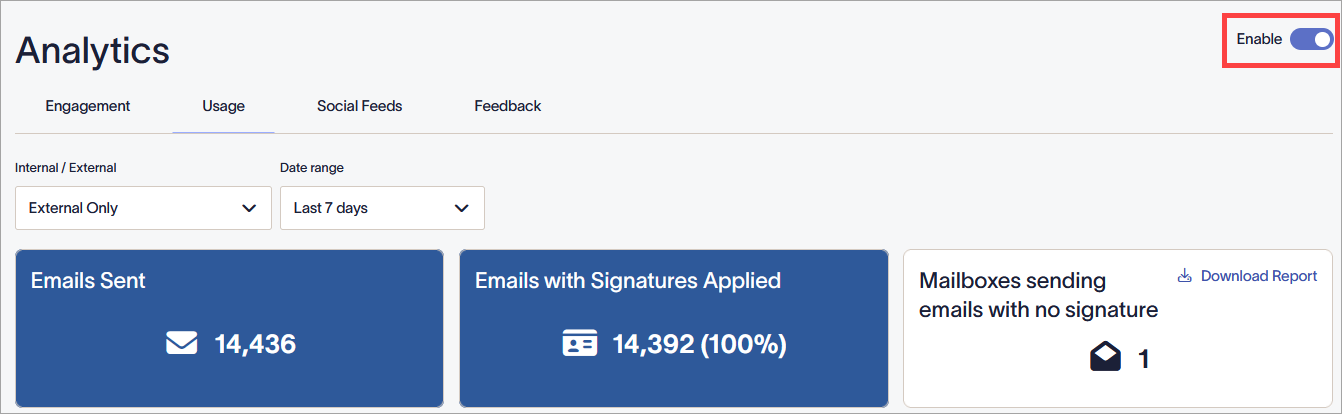
The Enable toggle in the On position.
If analytics is not enabled, your links are not changed, and data is not collected. Your dashboard will not show any data.
The Signature Usage Analytics dashboard displays information to help you analyze the application of your email signatures.
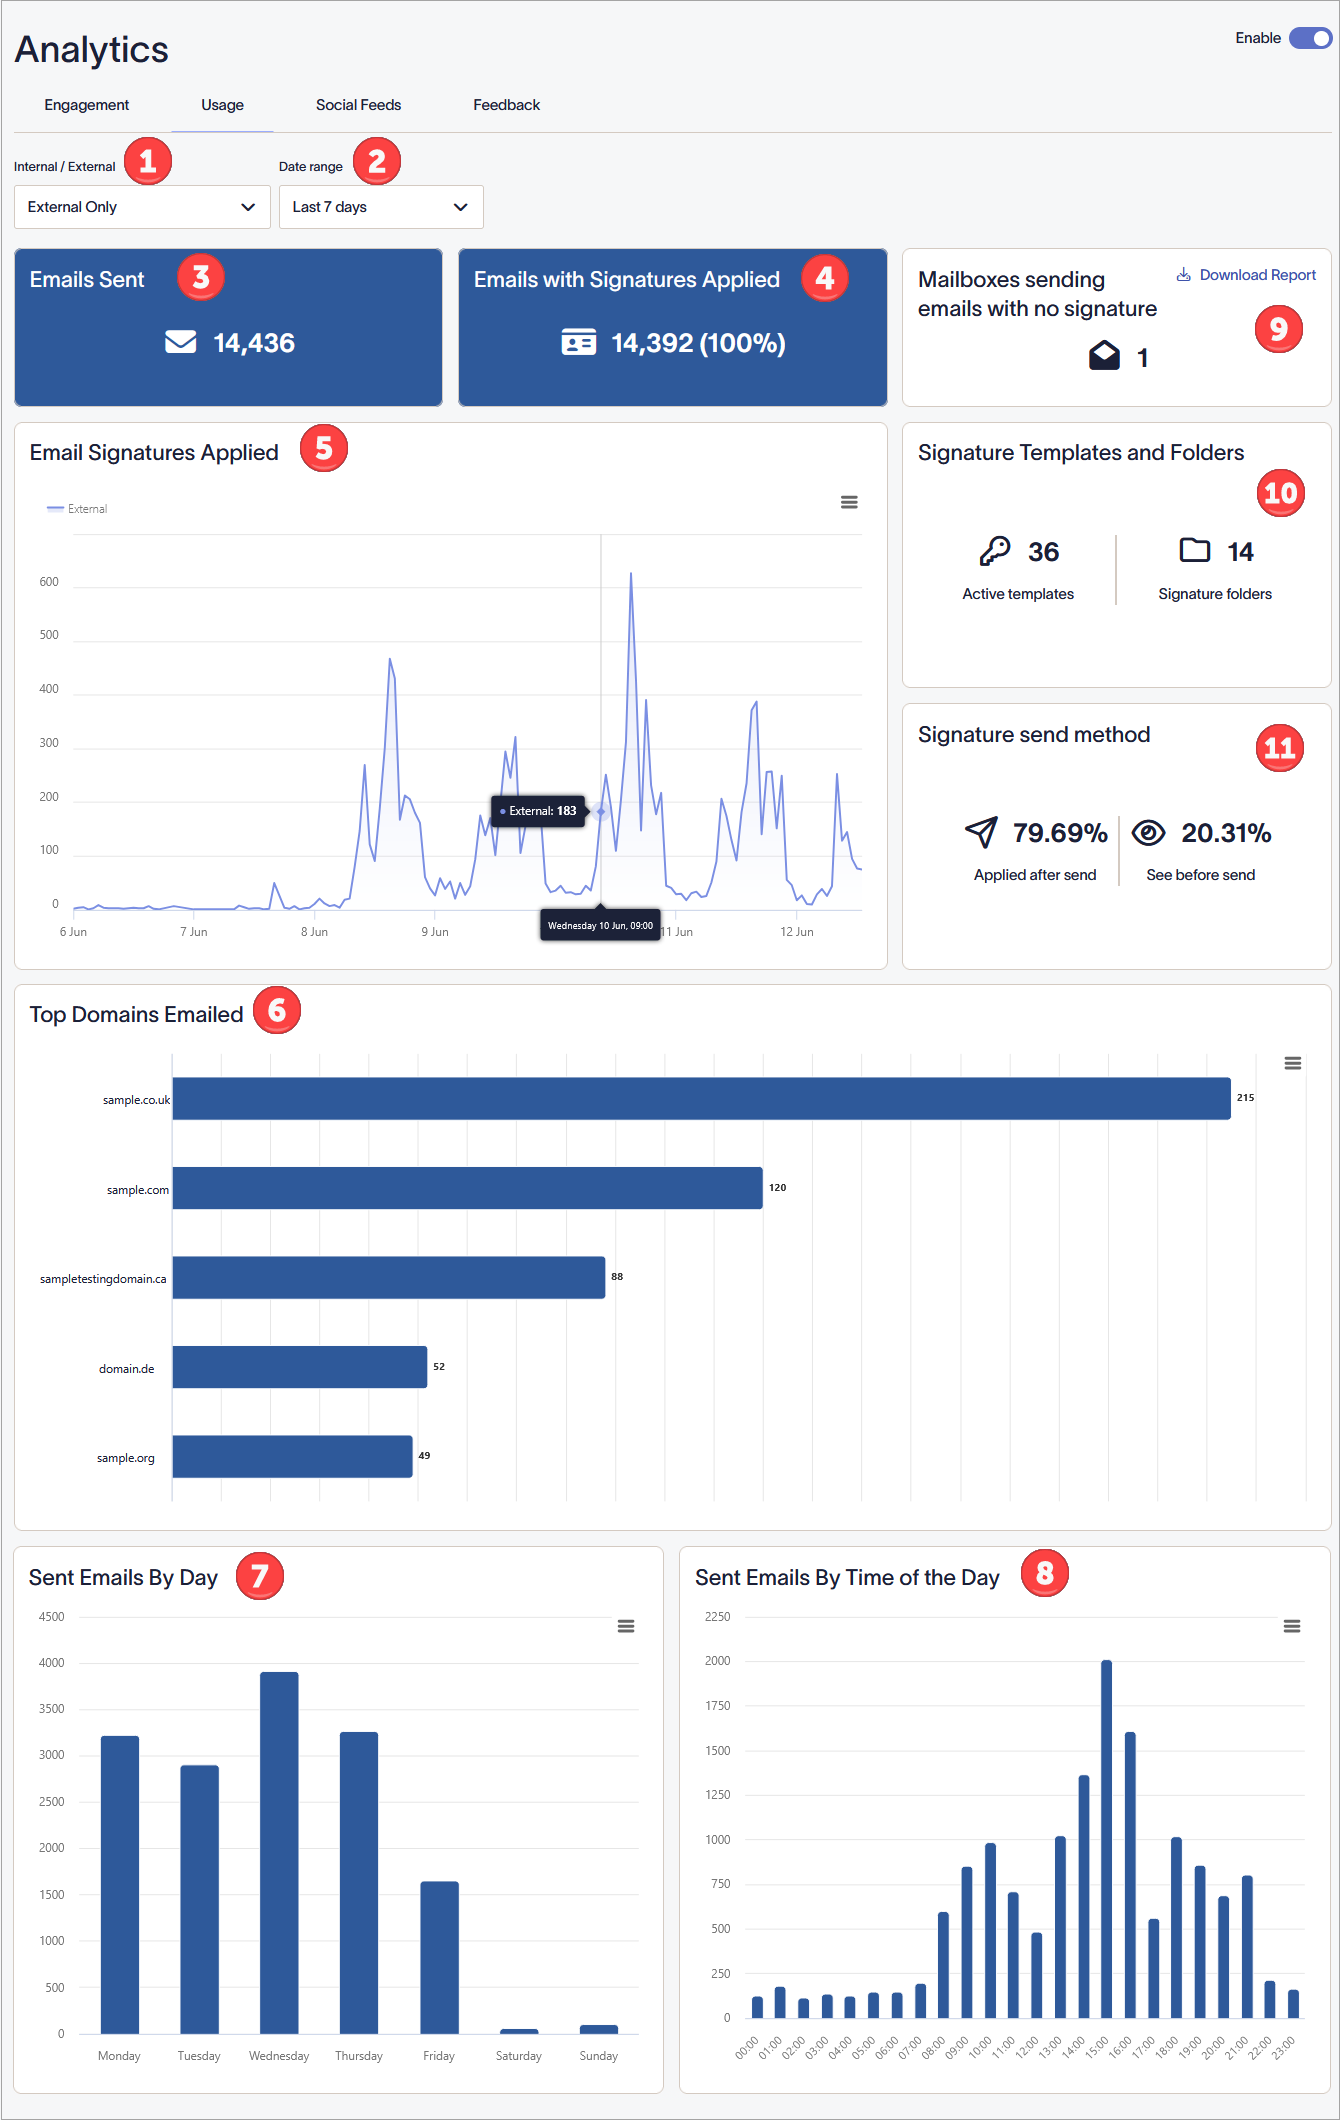
The Usage Analytics dashboard. Each number corresponds to a different section of the screen. Each section is described in the table.
The following table outlines the different options available on the Usage Analytics dashboard:
| Screen area | Feature description |
|
Internal/External |
Select a type of email from the drop-down list:
|
|
Date Range |
Select a date range from the drop-down list:
To set a Custom date range, enter or select a start and end date and time using the calendar picker. |
|
Emails Sent |
Displays the total number of emails sent in the specified date range. |
|
Emails with Signatures Applied |
Emails with Signatures Applied: Displays the total number and percentage of emails to which signatures were applied within the selected date range. |
|
Email Signatures Applied |
A line graph displaying the total number of emails that were sent with a signature in the specified date range. The axes are Y - Number of Emails Sent and X - Date and Time. Select the hamburger menu icon |
|
Top Domains Emailed |
Displays a bar chart showing the top five domains that have been sent emails in the specified date range, including number of emails sent to said domains. Select the hamburger menu icon |
|
Sent Emails by Day |
Displays a bar chart of the number of emails sent on each day of the specified date range. Select the hamburger menu icon |
|
Sent Emails by Time of the Day |
Displays a bar chart of the number of emails sent at each hour of the day within the specified date range. Select the hamburger menu icon |
|
Mailboxes sending emails with no signature |
Displays the total number of email addresses that sent emails in the specified date range without a signature applied. The is calculated by: Emails - Imprints = Unsigned Where: I = total unique email addresses in any imprint event within the filter U = total email addresses that were processed but not imprinted |
|
Signature Templates and folders |
Displays the following data:
|
|
Signature send method |
Displays the following data:
|